High Throughput Workflows for DNA Extractions from Oral Samples
January 16, 2018
Kiranmai Durvasula1, Jeff Roeder1, Travis Butts1, Mike Farrell1
1Omega Bio-tek, Inc., Norcross GA 30071
Introduction
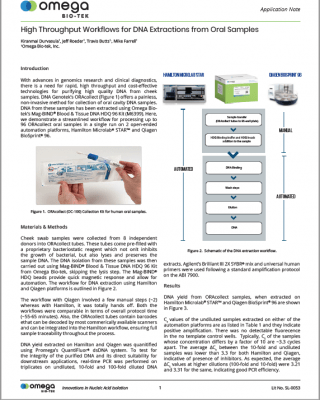
With advances in genomics research and clinical diagnostics, there is a need for rapid, high throughput and cost-effective technologies for purifying high quality DNA from cheek samples. DNA Genotek’s ORAcollect (Figure 1) offers a painless, non-invasive method for collection of oral cavity DNA samples. DNA from these samples has been extracted using Omega Bio-tek’s Mag-BIND® Blood & Tissue DNA HDQ 96 Kit (M6399). Here, we demonstrate a streamlined workflow for processing up to 96 ORAcollect oral samples in a single run on 2 open-ended automation platforms, Hamilton Microlab® STAR™ and Qiagen BioSprint® 96.
Learn more about the Mag-Bind® Blood & Tissue HDQ Kit
Materials and Methods
Cheek swab samples were collected from 8 independent donors into ORAcollect tubes. These tubes come pre-filled with a proprietary bacteriostatic reagent which not onlt inhibits the growth of bacterial, but also lyses and preserves the sample DNA. The DNA isolation from these samples was then carried out using Mag-BIND® Blood & Tissue DNA HDQ 96 Kit from Omega Bio-tek, skipping the lysis step. The Mag-BIND® HDQ beads provide quick magnetic response and allow for automation. The workflow for DNA extraction using Hamilton and Qiagen platforms is outlined in Figure 2.
The workflow with Qiagen involved a few manual steps (~2) whereas with Hamilton, it was totally hands off. Both the workflows were comparable in terms of overall protocol time (~55-65 minutes). Also, the ORAcollect tubes contain barcodes ethat can be decoded by most commercially available scanners and can be integrated into the Hamilton workflow, ensuring full sample traceability throughout the process.
DNA yield extracted on Hamilton and Qiagen was quantified using Promega’s QuantiFluor® dsDNA system. To test for the integrity of the purified DNA and its direct suitability for downstream applications, real-time PCR was performed on triplicates on undiluted, 10-fold and 100-fold diluted DNA extracts. Agilent’s Brilliant III 2X SYBR® mix and universal human primers were used following a standard amplification protocol on the ABI 7900.
Results
DNA yield from ORAcollect samples, when extracted on Hamilton Microlab® STAR™ and Qiagen BioSprint® 96 are shown in Figure 3.
Ct values of the undiluted samples extracted on either of the automation platforms are as listed in Table 1 and they indicate positive amplification. There was no detectable fluorecence in the no template control wells. Typically, Ct of the samples whose concentration differs by a factor of 10 are ~3.3 cycles apart. The average ΔCt between the 10-fold and undiluted samples was lower than 3.3 for both Hamilton and Qiagen, indicative of presence of inhibitors. As expected, the average ΔCt values at higher dilutions (100-fold and 10-fold) were 3.21 and 3.31 for the same, indicating good PCR efficiency.
We use cookies to ensure that we give you the best experience on our website. If you continue to use this site we will assume that you are happy with it.