Danny Flanigan¹, Lauren Golan¹, Archie Li¹, Kiranmai Durvasula¹, Chris Stuart¹, Julie Baggs¹, and Travis Butts¹
¹Omega Bio-tek, Inc, Norcross, GA 30071
Introduction
Formalin-fixed paraffin-embedded (FFPE) tissue samples are invaluable biospecimens that are increasingly being used in molecular level analyses and gene expression studies aiding the fields of cancer genomics, pathological diagnosis, biomarker discovery, immunotherapy research, and basic research. Obtaining high-quality and high-yielding DNA and RNA is challenging since nucleic acids in FFPE tissue samples are often fragmented and prone to chemical modifications. In response to this need, Omega Bio-tek’s Mag-Bind® FFPE DNA/RNA 96 Kit (M6955) delivers an innovative solution to reverse formaldehyde crosslinks and recover both DNA and RNA in distinct fractions from the same sample without splitting. The protocol uses non-toxic mineral oil in combination with heat for efficient deparaffinization of the FFPE sample and differentially purifies DNA and DNA-free RNA, allowing for a more comprehensive molecular analysis from a precious sample source. This approach, extracting DNA and RNA separately from the same FFPE sample, maximizes data from limited FFPE material, streamlining workflows and conserving material.
The Mag-Bind® FFPE DNA/RNA 96 Kit follows a magnetic bead-based approach and can be automated on most open-ended automation platforms such as the Hamilton Microlab® STAR™, Thermo Fisher Scientific KingFisher® system, Dynamic Devices’ Lynx®, as well as Omega Bio-tek’s MagBinder® Fit24. 96 samples can be processed in ~5 hours, enhancing laboratory efficiency and turnaround time which enables higher throughput and quicker data delivery. Here, we discuss the efficacy of using the Omega Kit for extraction of both DNA and RNA from three FFPE tumor samples (breast, colorectal, and lung) and compare its performance in terms of yield and quality, amplification sensitivity with comparable kits from two other manufacturers. The quality of purified DNA and RNA from the three different kits was evaluated in terms of their sequencing potential through Whole Exome (DNA) and RNA-seq (RNA) sequencing of the FFPE samples along with their paired fresh-frozen (FF) sample.
Learn more about the Mag-Bind® FFPE DNA/RNA 96 Kit.
DNA and RNA extraction Workflow Using Mag-Bind® FFPE DNA/RNA 96 Kit
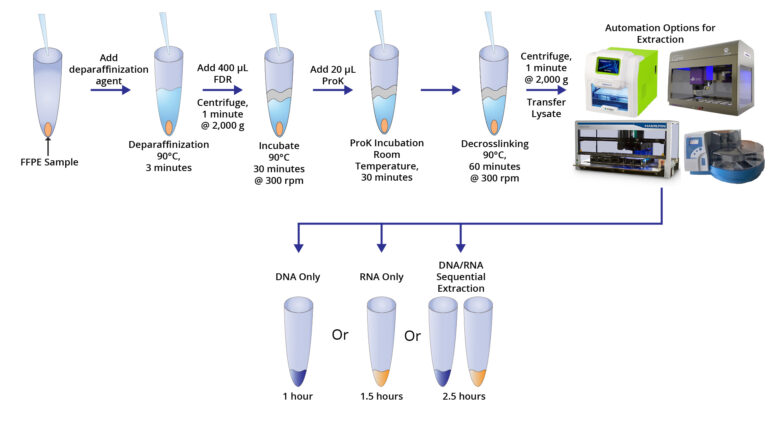
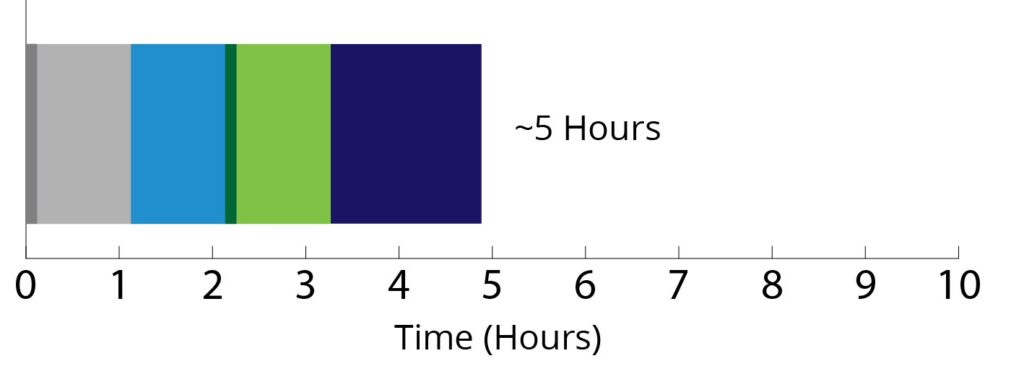
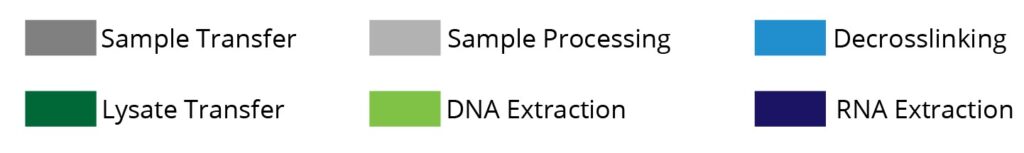
Figure 1. Workflow for sequential isolation of DNA and RNA from the same FFPE sample using Omega Bio-tek’s Mag-Bind® FFPE DNA/RNA 96 Kit.
Materials and Methods
DNA and RNA Extraction
FFPE sections from three different tumor samples (breast, lung, and colorectal tissues) along with their paired fresh frozen (FF) samples were sourced from ProteoGenex (Inglewood, CA). DNA and RNA were extracted from 3 x 10 µm sequential sections of each of these cancerous samples using Omega Bio-tek’s Mag-Bind® FFPE DNA/RNA 96 Kit and comparable kits from Company T and Company Q, following manufacturer’s recommended protocols. Figure 1 shows the extraction workflow followed by the Omega Bio-tek Mag-Bind® FFPE DNA/RNA 96 Kit.
Omega Bio-tek’s and Company T’s extraction protocol was magnetic-bead based whereas the protocol was silica column-based for Company Q. Non-toxic mineral oil was employed for the deparaffinization of the FFPE tissue sample in the Omega Bio-tek and Company T’s protocol whereas xylene was used for Company Q’s. Extractions were carried out in replicates of 5 from the same FFPE tissue sample in a single workflow for all three kits. Purified DNA and RNA were eluted in 50 μL for all three kits tested.
DNA and RNA from the FF samples were extracted using Omega Bio-tek’s Mag-Bind® Blood & Tissue DNA HDQ 96 kit (M6399) and Mag-Bind® Total RNA 96 kit (M6731), respectively, following manufacturer’s recommended protocols.
Quantification and Quality Analysis
The fragment sizes and quality of the extracted DNA and RNA were analyzed on Agilent’s TapeStation® 2200 by running a DNA and RNA tape. The nucleic acid concentration was also estimated using TapeStation Analysis software. DV200 (the percentage of RNA fragments >200 nucleotides) of the purified RNA was also derived from the RNA tape which is predictive of RNA quality and serves as a guideline for success estimation in a sequencing workflow. Nucleic acid purity was analyzed by focusing on A260/A230 and A260/A280 absorbance ratios measured using Thermo Scientific’s NanoDrop™ 2000c system.
qPCR and RT-qPCR Assays
The downstream functionality of the extracted nucleic acids was assessed by performing qPCR and RT-qPCR on 10-fold dilution of samples. Purified RNA was first transcribed into complementary DNA (cDNA) through reverse transcription and amplified using exon spanning primers specific for cDNA for accurate RNA analysis. A 20 μL qPCR reaction was set up using Agilent’s Brilliant III 2X SYBR® as the master mix and 2 μL of DNA or cDNA at appropriate dilution as template and amplified with specific primers following a standard protocol on the ABI 7900.
The formalin-fixation and paraffin embedding process introduces cross linking and fragmentation through chemical modification in the nucleic acids, thereby compromising their quality. To evaluate how close the FFPE sample resembles the FF control, DNA and RNA extracted from paired FFPE-FF samples using the three manufacturer’s kits were amplified at equal mass inputs. The ΔCt value was then calculated by subtracting the Ct values obtained from the FF samples from the corresponding Ct values obtained from the FFPE samples to assess the quality of DNA for molecular analysis.
Next-Generation Sequencing
DNA and RNA extracted using the three kits from breast and lung FFPE samples along with their paired FF samples were subjected to whole exome (DNA) and RNA-seq (RNA) sequencing. The sequencing was carried out by Genewiz from Azenta Life Sciences (South Plainfield, NJ) on IlluminaR NovaSeq™ System.
Results and Discussion
Average DNA Yield from Different FFPE Tumor Samples
Superior RNA Yields Across All Sample Types Tested
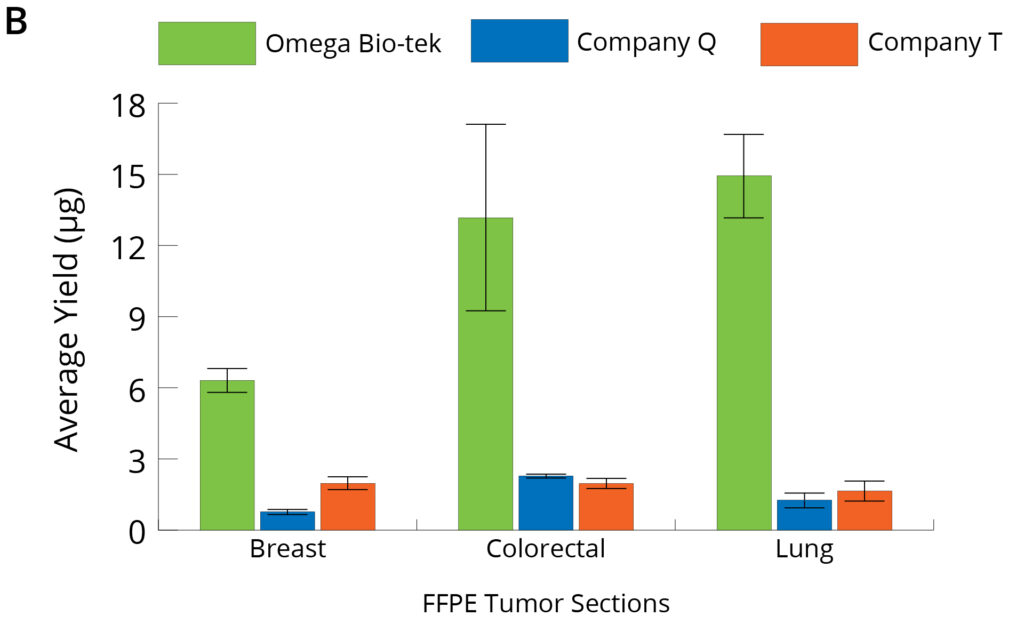
Figure 2. Genomic DNA (A) and RNA (B) were sequentially isolated from the 3 x 10 µm sections of the same FFPE tumor tissue block (n=5) using Omega Bio-tek’s Mag-Bind® FFPE DNA/RNA 96 Kit and comparable kits from Company Q and Company T, following manufacturers’ recommended protocols. Purified DNA and RNA were quantified using TapeStation Analysis.
The average DNA and RNA yields quantified using TapeStation Analysis software from FFPE sections of breast, lung, and colorectal tumor tissue samples using the different manufacturer’s kits are as shown in Figure 2. DNA yield was comparable or better vs Company T from all the three FFPE tissues tested where it was comparable for only one sample vs Company Q. However, RNA recovery was significantly higher with Omega Bio-tek’s kit for all the samples tested compared to kits from Company Q and Company T (p<0.05; Tukey’s post-hoc analysis).
DNA Purity
RNA Purity
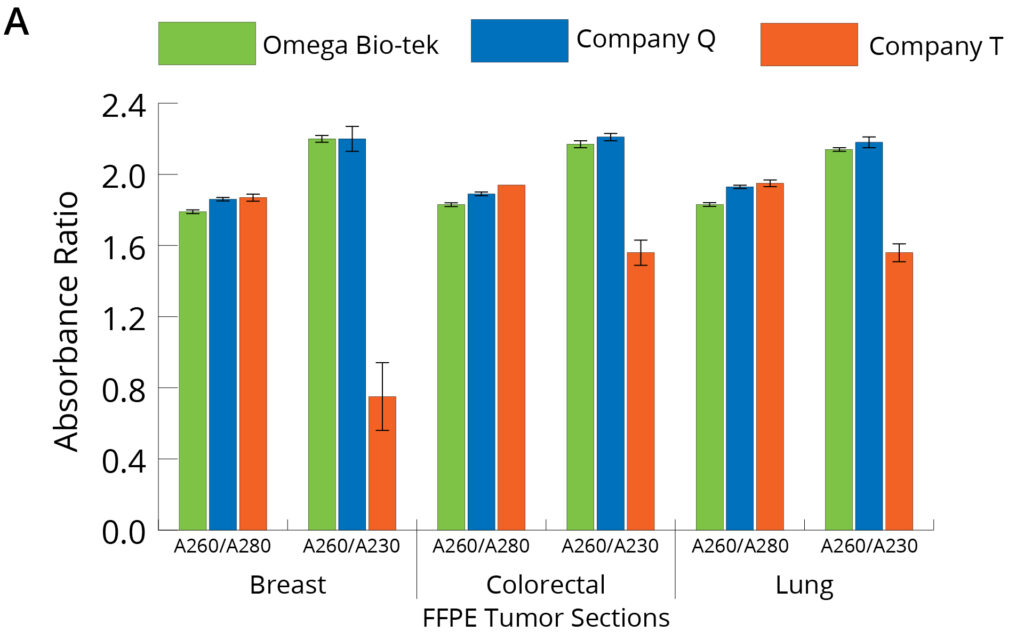
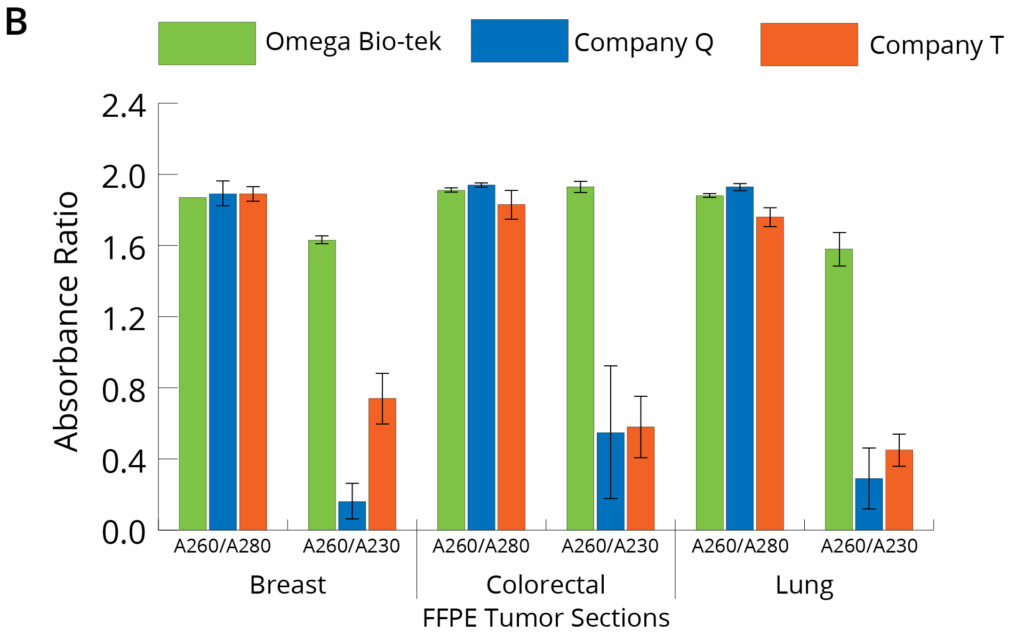
Figure 3. Purity of DNA (A) and RNA (B) isolated using different manufacturers’ kits was anlayzed through spectrophotometry focusing on A260/A280 and A260/A230 ratios.
Figure 3 shows the absorbance ratios of the nucleic acids (A260/A280 and A260/A230) and were used to assess the DNA and RNA purity post-extraction using the three different kits. The average A260/A280 ratio for DNA and RNA following Omega Bio-tek’s protocol was close to the theoretical 1.8 and 2.0, indicating pure DNA and RNA (DNA ~1.8 and RNA ~1.9 for breast, lung, and colorectal tumor tissue samples) (Figure 3). These ratios also indicate efficient separation of DNA and RNA into separate eluates during the extraction protocol. A260/a280 values are comparable across all three extraction kits tested. However, the A260/A230 values for DNA following Company Q’s were comparable to Omega Bio-tek’s, whereas those following Company T’s extraction were lower than those of Omega Bio-tek’s, indicating contaminant carryover into the DNA eluate. A260/A230 values of the purified RNA following Company Q and T’s kits were significantly lower than Omega Bio-tek’s, indicating contaminant carryover into RNA eluate. For instance, A260/A230 value of RNA purified from lung FFPE tissue was 1.9, 0.3, and 0.5 using kits from Omega Bio-tek, Company Q, and Company T, respectively. These values suggest that RNA extracted using the Omega Bio-tek kit was of superior quality to that extracted using the other two kits with DNA being comparable across all kits.
PCR Analysis of DNA and RNA Extracted from Different FFPE Tumor Samples
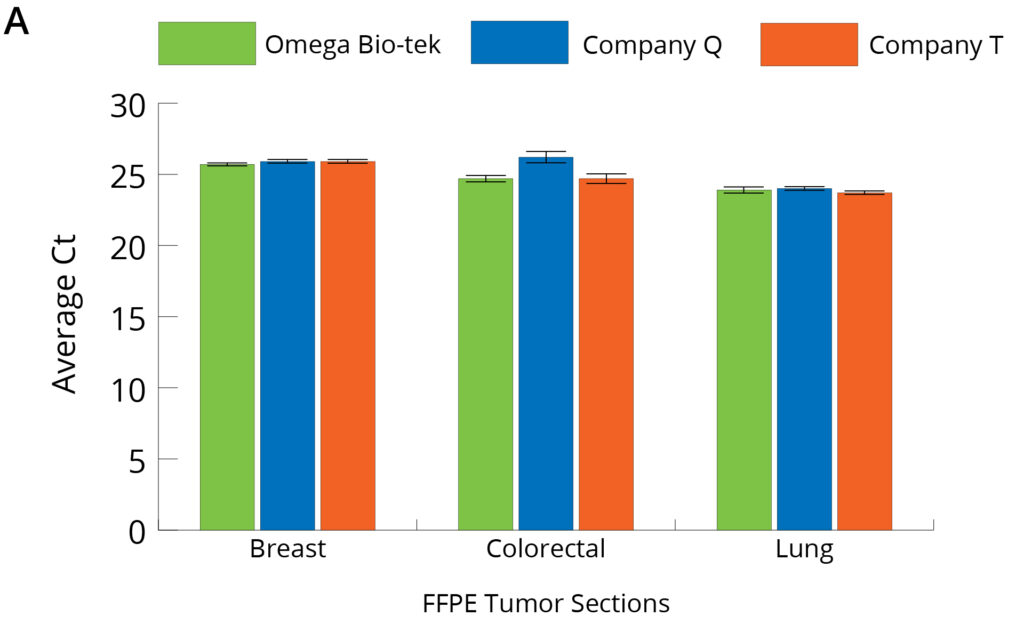
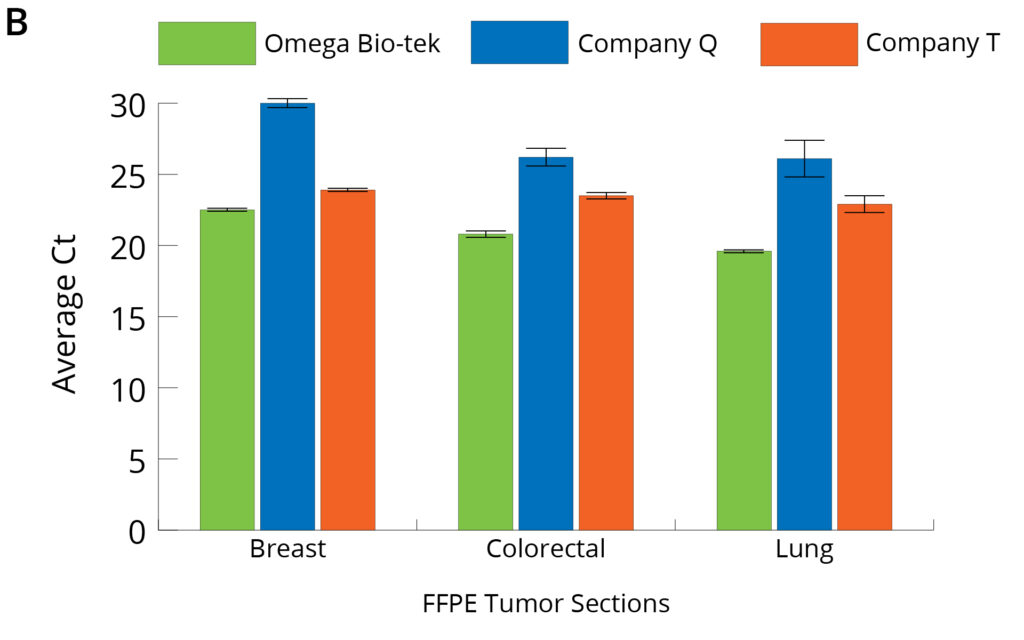
Figure 4. Average Ct values obtained on 10X dilutions of DNA (A) and RNA (B) purified from 3 x 10 µm sections of FFPE tumor tissue (n=5).
The quality and downstream functionality of the DNA and RNA obtained following protocols from the three kits was also assessed by comparing Ct values generated from a qPCR reaction. Figure 4 shows the average Ct values obtained at 10-fold dilution of the purified DNA and RNA when amplified using DNA- and RNA-specific primers for accurate assessment of each. Average Ct values obtained on 10X dilutions of DNA (A) and RNA (B) purified from 3 × 10 μm sections of FFPE tumor tissue (n=5). Ct values were comparable for DNA extracted using all three kits. This suggests similar amplification profiles at 10-fold diluted DNA across all the kits tested and not indicative of higher DNA yields from colorectal and lung FFPE tissue samples obtained using Company Q’s kit. Conversely, Ct values for 10-fold dilutions of RNA extracted using Omega Bio-tek’s kit were significantly lower than those of Company Q’s and Company T’s corroborating higher RNA yields obtained using Omega Bio-tek’s Mag-Bind® FFPE DNA/RNA 96 kit.
The TapeStation analysis software enabled the assessment of DV200 values of the RNA extracted from the three FFPE tumor
tissue samples and are as shown in Figure 5. Omega Bio-tek’s kit resulted in purified RNA with DV200 consistently over 70% across all the three sample types tested. The results indicate that the RNA extracted using the Omega Bio-tek protocol has higher DV200 values compared to the RNA extracted using Company T and Q’s kits indicating superior quality RNA (Breast – 72% with Omega vs 65% with Company T and 33 % with Company Q; Lung – 76% with Omega vs 33% with Company T and 27% with Company Q; Colorectal – 73% with Omega vs 39% with Company T and 55% with Company Q). A higher DV200 score with Omega Bio-tek’s Kit points to a greater proportion of longer RNA fragments, which increases the likelihood of successful and accurate NGS results.
Superior DV200 Values of Purified RNA
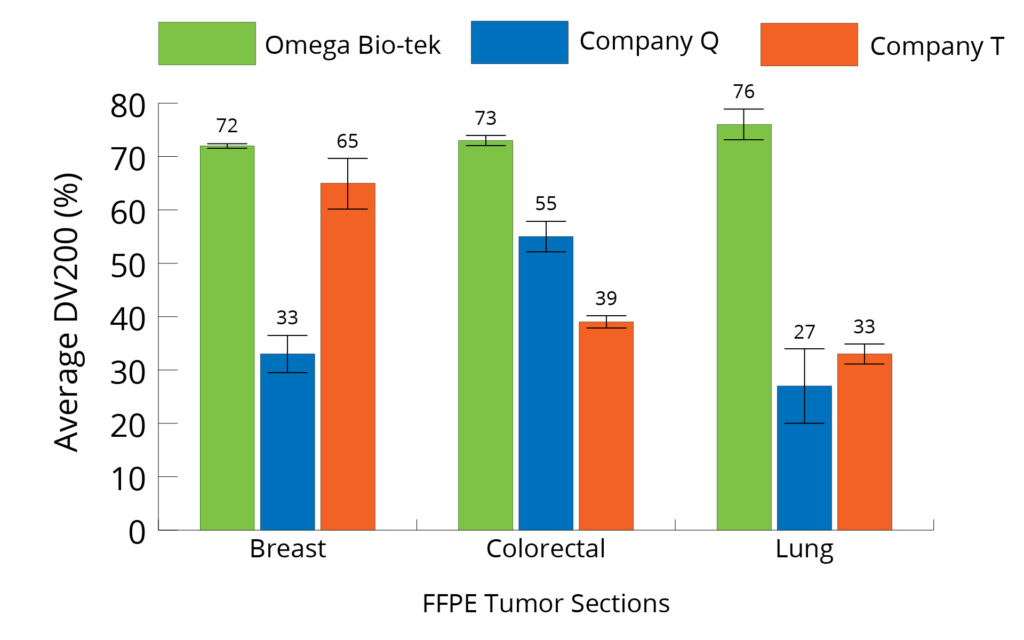
Figure 5. Average DV200 value (% of fragments > 200 nt) of RNA purified using different kits analyzed on Agilent’s TapeStation® 2200.
Table 1. ΔCt of FFPE Tissue Sample relative to FF.
| DNA | RNA | |||||
|---|---|---|---|---|---|---|
| Kit | Breast | Colorectal | Lung | Breast | Colorectal | Lung |
| Omega Bio-tek | 3.2 | 2.5 | 2.3 | 0.6 | 1 | 0.8 |
| Company Q | 3.7 | 2.7 | 2.1 | 6.2 | 4.7 | 5.3 |
| Company T | 3.1 | 2.4 | 1.9 | 0.9 | 2.3 | 2.3 |
Table 1 shows the ΔCt values estimated for all the three FFPE tumor tissue samples relative to fresh frozen at equal mass input of DNA purified using kits from Omega Bio-tek, Company T and Q. ΔCt for Omega Bio-tek’s extraction, especially for RNA are closer to theoretical 0 indicating equal expression in FFPE compared to FF, hence a better representative of FF sample. ΔCt values for DNA were comparable for all the kits tested.
Table 2. DNA Sequencing Metrics based on Whole Exome Sequencing of paired FFPE-FF samples.
| FFPE Tumor Tissue Type | Kit | Average Median Insert Size (n=4) | Average % Target Coverage ≥ 50X (n=4) | Average % Aligned Reads (n=4) |
|---|---|---|---|---|
| Breast | Omega Bio-tek | 173 | 94.8% | 99.4% |
| Company Q | 151 | 91.4% | 99.3% | |
| Company T | 149 | 87.6% | 99.6% | |
| Fresh Frozen | 219 | 93.3% | 99.4% | |
| Lung | Omega Bio-tek | 166 | 72.9% | 99.4% |
| Company Q | 151 | 76.0% | 99.4% | |
| Company T | 155 | 73.7% | 99.4% | |
| Fresh Frozen | 222 | 95.4% | 99.3% |
DNA and RNA from the breast and lung FFPE and paired FF samples extracted using the three kits were subjected to whole exome and RNA sequencing. For DNA extracted from different kits, we tracked the following sequencing metrics – average median insert size (bp), % average target coverage and % average aligned reads (Table 2). The table suggests that average median size and target coverage % for Omega Bio-tek’s kit are closer to FF tissue than other two competitor kits. For breast FFPE sample, the average median insert size of the FF sample was 219 and Omega Bio-tek’s was 173 whereas it was 149 and 151 for Company T and Q respectively. Similarly for lung FFPE tissue, the average median insert size of the FF sample was 222 and Omega Bio-tek’s was 166 whereas it was 155 and 151 for Company T and Q respectively. The average percentage of aligned reads was comparable for all the kits tested.
Table 3. Concordance Analysis of Variant Calling for FFPE Samples Relative to Fresh Frozen
| FFPE Tumor Tissue Type | Baseline | Kit | Intersection | Unique Baseline | Unique Sample | Union | Jaccard Coefficient |
|---|---|---|---|---|---|---|---|
| Breast | FF | Omega Bio-tek | 16154 | 2646 | 2309 | 21109 | 0.77 |
| Company Q | 14954 | 3846 | 1943 | 20743 | 0.72 | ||
| Company T | 13924 | 4876 | 1792 | 20592 | 0.68 | ||
| Lung | FF | Omega Bio-tek | 13257 | 3872 | 574 | 17703 | 0.75 |
| Company Q | 13159 | 3970 | 541 | 17670 | 0.74 | ||
| Company T | 13266 | 3863 | 540 | 17669 | 0.75 |
Legend:
Intersection — variants found in both FF and FFPE Sample
Unique Baseline — variants only in FF, missing in FFPE
Unique Sample — variants only in FFPE, missing in FF
Union — total unique variants across FF + FFPE
Jaccard Coefficient — Intersection / Union ⇔ measure of similarity (1 = identical, 0 = no overlap)
Concordance between the FFPE and FF samples for variant calling was evaluated by calculating Jaccard co-efficient to draw conclusions on similarities between the two sets (Table 3). In other words, it is a ratio of variant calls common to both FF and FFPE samples to the sum total of variant calls made in both FF and FFPE samples. A value of 1 means that the sample sets are identical and 0 means that they are dissimilar with no commonality. The results indicate Omega Bio-tek’s kit achieved the highest similarity in variant calls between breast FFPE and FF samples (Jaccard = 0.77), indicating closer representation to the FF sample. For breast FFPE tumor sample, Jaccard co-efficient was 0.72 and 0.68 for Company Q and T respectively. Jaccard co-efficient was comparable across all the three kits tested for lung FFPE sample.
Table 4. Average Uniformity of Coverage, mean and median target coverage for FFPE samples relative to Fresh Frozen
| FFPE Tumor Tissue Type | Kit | Average Uniformity of Coverage (n=4) | Average Mean Target Coverage (n=4) | Average Median Target Coverage (n=4) |
|---|---|---|---|---|
| Breast | Omega Bio-tek | 93% | 126 | 117 |
| Company Q | 95% | 91 | 91 | |
| Company T | 94% | 86 | 85 | |
| Fresh Frozen | 97% | 91 | 90 | |
| Lung | Omega Bio-tek | 54% | 201 | 105 |
| Company Q | 68% | 154 | 103 | |
| Company t | 79% | 102 | 84 | |
| Fresh Frozen | 94% | 123 | 114 |
Average uniformity of coverage, mean and median target coverage was also analyzed to derive information about the consistency of sequencing depth across the targeted exonic regions (Table 4). For breast FFPE sample, the average uniformity of coverage was comparable to the FF sample for all the three kits tested (93% for Omega Bio-tek, 95% for Company Q, 94% for Company T and 97% for FF). The average mean and median target coverage was comparable for all the data sets suggesting the exons were uniformly sequenced with no outliers. The average mean and median target coverage for Omega Bio-tek extraction was higher than that of FF indicating that the target region was sequenced more than FF. These metrics were comparable to FF for the other two extraction kits. For lung FFPE samples, the average uniformity of coverage, mean and median target coverage was comparable to the FF sample for extraction performed using Company Q and T’s kits. For the Omega Bio-tek kit, the average uniformity of coverage was 54% compared to 94% with FF. Interestingly, the average mean target coverage was 201 compared to 123 with FF whereas the average median coverage was more aligned with that of FF’s. This suggests that a small subset of exons was over sequenced presenting as outliers skewing the mean. Average median target coverage representing “typical” coverage depth was not skewed by outliers and was comparable to that of FF’s. The discrepancy in average uniformity of coverage could likely be due to hybridization issues since the Jaccard co-efficient analysis showed a high degree of similarity in variant calling to the FF sample.
Table 5. RNA Sequencing Metrics
| FFPE Tumor Tissue Type | Kit | Average Median Insert Size (n=4) | Average % Properly Paired Reads (n=4) | Average % Duplicate Reads (n=4) | Average % Unmapped Reads (n=4) |
|---|---|---|---|---|---|
| Breast | Omega Bio-tek | 136 | 98.7% | 32.5% | 1.2% |
| Company Q | 131 | 94.7% | 63.7% | 5.0% | |
| Company T | 163 | 98.4% | 37.9% | 1.5% | |
| Fresh Frozen | 152 | 97.8% | 31.9% | 1.8% | |
| Lung | Omega Bio-tek | 143 | 98.4% | 23.2% | 1.4% |
| Company Q | 142 | 97.9% | 43.5% | 1.8% | |
| Company T | 140 | 98.2% | 29.7% | 1.7% | |
| Fresh Frozen | 151 | 97.6% | 26.2% | 1.8% |
Table 5 shows the average median insert size, paired reads, duplicate reads as well as unmapped reads post sequencing of RNA purified using all three kits from breast and lung FFPE tumor samples along with their FF control. Sequencing metrics indicate comparability between all tested kits for median insert size and paired reads. However, Company Q had nearly 2x higher duplicate reads rate which may result in loss depth by taking up reads that could otherwise be unique. For breast FFPE sample, Company Q had higher unmapped reads (5%) compared to Omega Bio-tek (1.2%), Company T (1.5%) and FF (1.8%) may be due to contaminating genomic DNA in the RNA eluate.
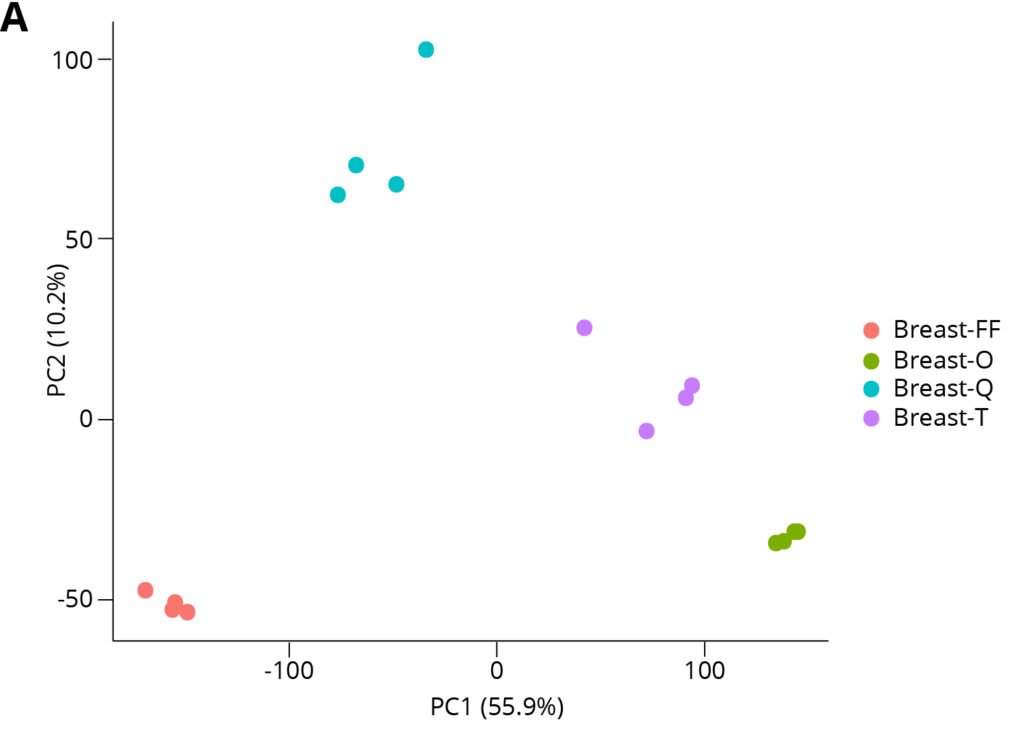
Principal Component Analysis of RNA-seq TPM Values
Breast FFPE Tumor Tissue Type
Lung FFPE Tumor Tissue Type
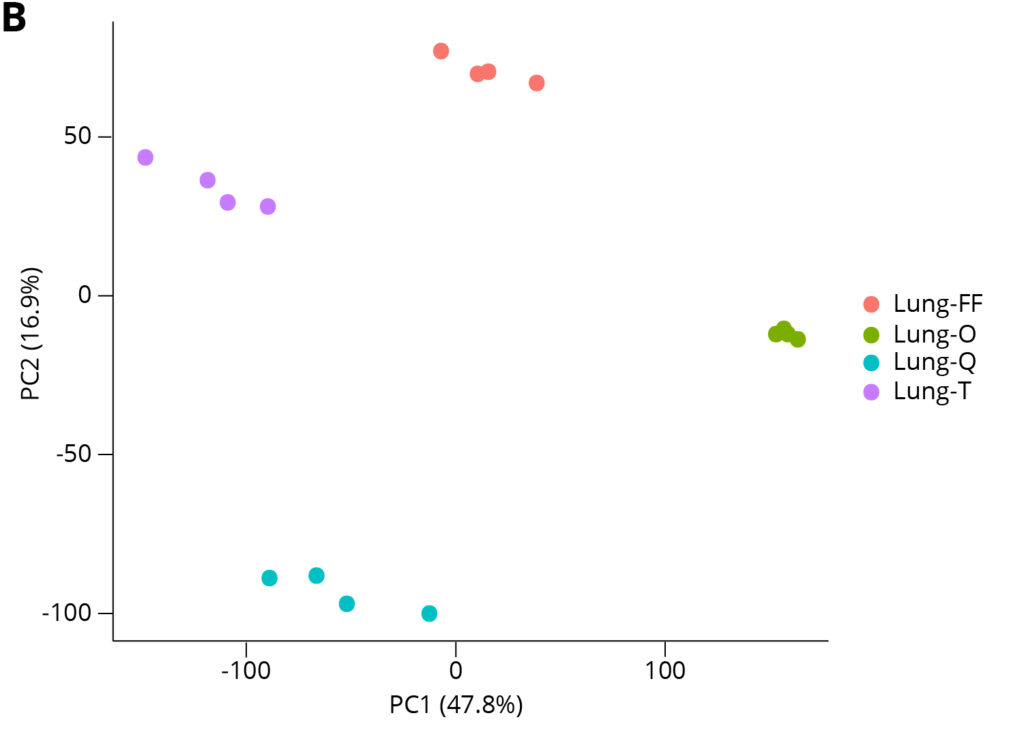
Figure 6. Principal Component Analysis reveals that extraction method is the driving cause of variance between data sets, and the Omega Bio-tek extracted samples exhibited tight clustering, indicative of good intra-replicate consistency.
Principal Component Analysis (PCA) was carried out on the RNA-seq transcripts per million (TPM) data to visualize sample similarities between different data sets. Figure 6 shows PCA analysis for breast and lung FFPE samples. The distinct clustering of extraction conditions indicates that variance between conditions is mostly caused by the extraction methodology/kit used. The proximity of the data points within their clusters indicates intra-replicate variability. Omega Bio-tek extracted samples yielded tight clustering indicating good consistency between the technical replicates and therefore, consistent gene expression profiles across the technical replicates.
Differentially Expressed Genes (DEG) Analysis Showing Up- and Down-Regulated Genes Relative to FF
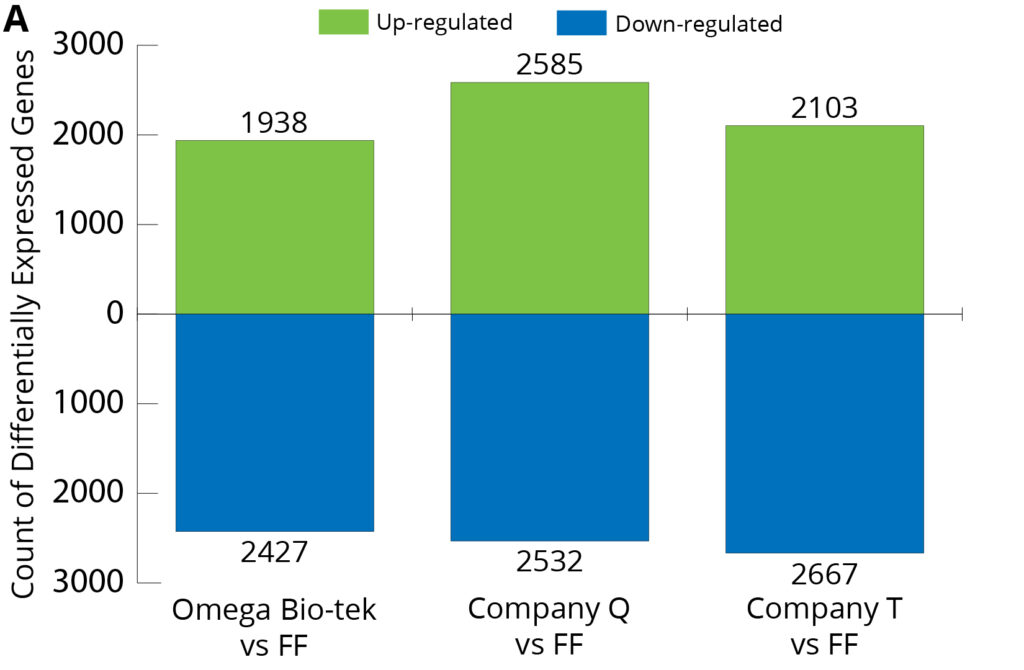
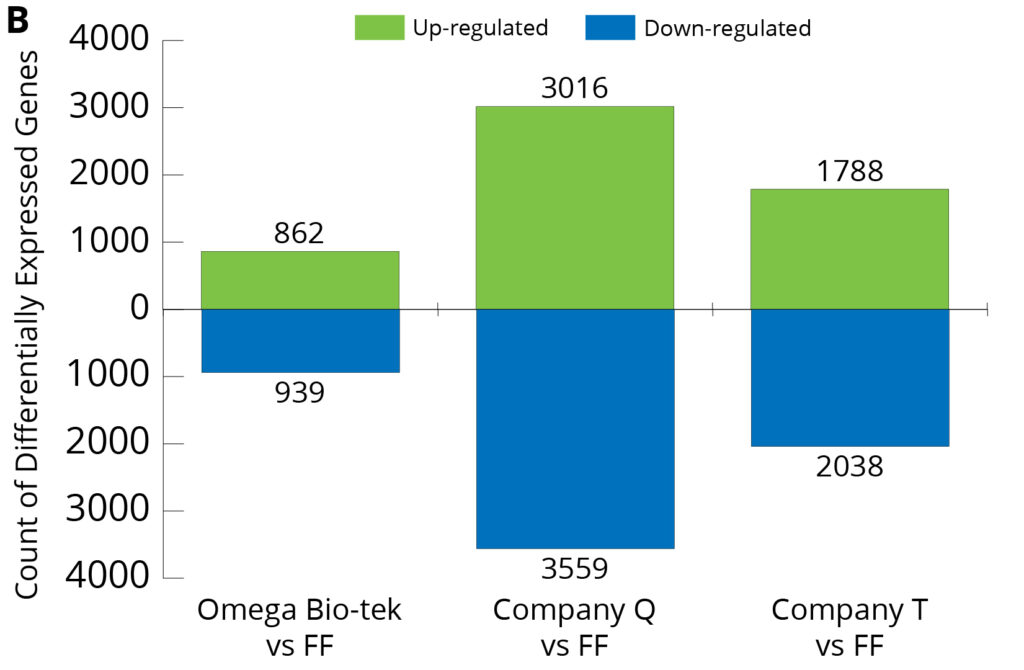
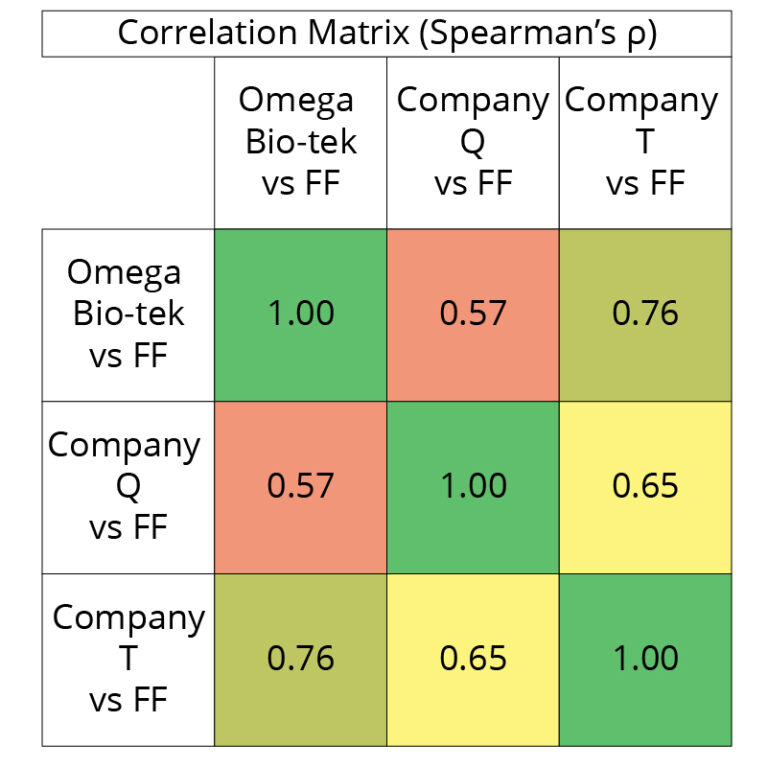
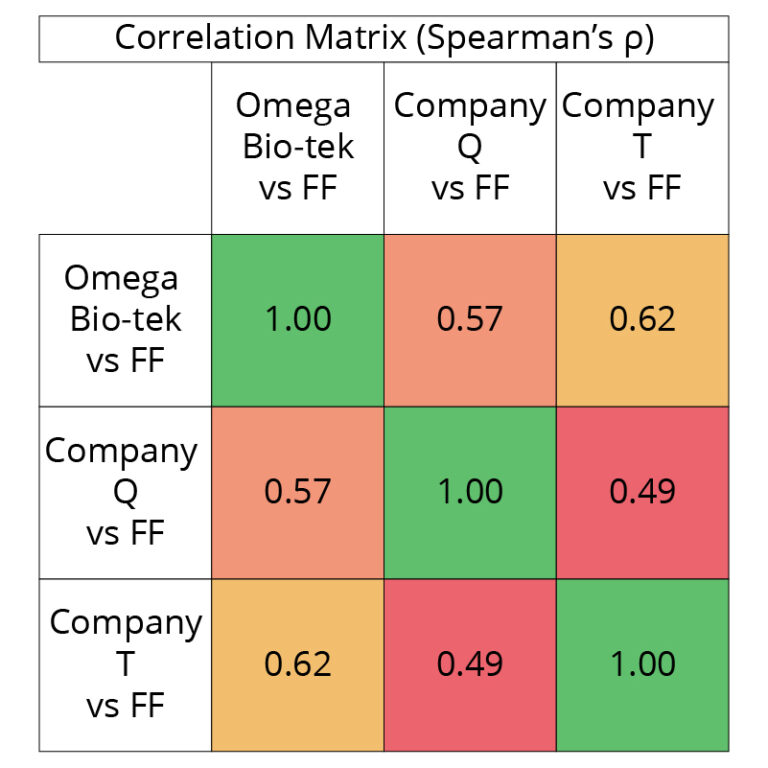
Figure 7. Differentially Expressed Gene Analysis of three extraction conditions compared to FF from breast (A) and lung (B) tissues.
Using the RNA sequencing data, Differentially Expressed Gene (DEG) Analysis was carried out, and gene expression profiles were compared between the FF and the three kits (Omega Bio-tek, Company Q and Company T) (Figure 7). DEG Analysis shows the number of genes with expression levels significantly different than the FF control. In both FFPE tumor tissue types, Omega Bio-tek extraction had the lowest level of both up- and down-regulated genes relative to FF. Particularly in lung FFPE tumor samples, the analysis identified 862 up-regulated and 939 down-regulated differentially expressed genes in Omega Bio-tek extraction compared to the control (FF). In comparison, up-regulated genes were 3016 and 1788, down-regulated genes were 3559 and 2038 for Company Q and T respectively, higher than Omega Bio-tek’s. This suggests that the gene expression profile for Omega Bio-tek extracted samples resemble FF more
closely than those extracted using Company Q and T’s kits. Spearman’s Correlation matrix (Figure 7) compares the global expression profiles for the three conditions compared to the FF control. A value of 1 being perfect positive correlation of relative expression profile between compared groups and 0 being no correlation. This table indicates the Omega Bio-tek and Company T extracted samples share a strong correlation (0.60 ≤ ρ ≤ 0.79) in terms of global expression profile for both sample types whereas the correlation between Omega Bio-tek and Company is moderate (0.40 ≤ ρ ≤ 0.59).
Conclusions
Omega Bio-tek’s Mag-Bind® FFPE DNA/RNA 96 Kit can extract both DNA and RNA from the same FFPE sample and exhibited close resemblance to Fresh Frozen control when compared to kits from Company T and Company Q. The magnetic bead-based approach of the Omega Bio-tek’s kit is high-throughput friendly and aims to significantly enhance laboratory efficiency through automation and turnaround time, enabling higher throughput and quicker data delivery. This is a distinct advantage over Company Q’s kit which is column-based. The high quality of nucleic acids purified using Omega Bio-tek’s kit endorse their downstream functionality and corroborate their potential success in sequencing workflows.
Related Products
-
Cultured Cells and Tissue
Mag-Bind® FFPE DNA/RNA 96 Kit
$0.00 – $2,443.40Price range: $0.00 through $2,443.40 Select options This product has multiple variants. The options may be chosen on the product page -
Blood and Bodily Fluids
Mag-Bind® Blood & Tissue DNA HDQ 96 Kit
$0.00 – $5,426.70Price range: $0.00 through $5,426.70 Select options This product has multiple variants. The options may be chosen on the product page -
Cultured Cells and Tissue
Mag-Bind® Total RNA 96 Kit
$0.00 – $1,286.20Price range: $0.00 through $1,286.20 Select options This product has multiple variants. The options may be chosen on the product page